Saturday, January 28, 2017

SolGold - Casabel Update

DISCLOSURE - I own shares in SolGold as I think it is one of the best porphyry projects currently being explored.

We have been receiving some news from SolGold about how drilling is progressing at Cascabel (link and link).

Summary


  • No surprises, the holes announced (18, 19 and 20R) hit copper mineralization where expected
  • Hole 18 is an infill hole = will return great grades but won't add many tonnes
  • Hole 19 and 20 are very conservative, with minor (50-75m) step outs from earlier decent grade holes
    • they appear to show that the porphyry is quite narrow (~250m wide)
I was disappointed that Sol Gold wasn't going to be a but more adventurous with their drilling and have one of the 3 rigs drilling a bit further away (e.g. around Alpala SE) to test the upside at Alpala - is it a series of medium sized porphyries or 1 enormous one.

Maybe next time...

Here are my officially bad (tm) resource calculations


So that isn't too bad, it will be interesting how these results compare to the official numbers.

You can download my 3D model and resource calculation spreadsheet from here (link), and you can e-mail me if you want the complete project.

Section 1 - Hole 18


Black bars = where DH have intersected copper mineralization in SolGold PRs
We can see that hole 018 is only 50m away from hole CSD-14-008 and CSD-15-014. We can then predict what it will intersect my predictions are:

  •  0.5% Cu and 0.5 g/t Au from 1000 to 1450m
    • including ~0.8-1% Cu and >1 g/t Au from 1050 to 1250m

Section 2 - holes 19 and 20R

Red line - approx. extents of porphyry mineralization
We can see that holes 19 and 20 are again minor step outs from earlier high-grade holes, and hole 19 hit mineralization where expected (i.e. at the same point where hole CS-16-017 hit mineralization), as did hole 20R. No surprises here. My prediction for hole 19 is:
  • 0.5% Cu and 0.6 g/t Au from 325.6 to 1161.5m
    • including ~0.6-0.8% Cu and ~1 g/t Au from 850 to 1161.5m
    • 325.6 to 850 will run around 0.4% Cu and 0.35 g/t Au
For hole 20 I'm not going to predict grades, but I think that Cu-Au mineralization will be intersected from 905.4 to 1450m, where it will pass very close to (less than 50m) hole CSD-16-016 that hit a nice high grade zone from 934-1301m that graded 1.34 g/t Au and 1.01 % Cu.


One downside is that the porphyry appears to be quite narrow (only 250-300m) wide, the best mineralization is very deep (750m depth).


Friday, January 20, 2017

Bulk Density - an overlooked part of a resource calculation

I touched on this as part of my series of posts on the Hermosa project, and I wanted to expand.

Tonnes = volume x bulk density

Companies spend a lot of time calculating the grade and the volume, but as we saw with Taylor deposit there have been a few cock-ups cause by not getting the actually density of the different rock that contains the metals you want.

Bulk Density is also specific gravity - this is the mass of a rock within a certain volume and is normally expressed as grams per cubic centimeter or tonnes per cubic meter.

For reference water has an SG of 1 which means:

  • 1 cm3 of water weights 1 gram, 
  • 1 m3 of water weights 1,000,000 grams or 1 tonne.

SG of different rocks - link
SG of different sulfide minerals - link

The SG value for a rock if affected by porosity (microscopic spaces between the grains), fracturing (faulting), weathering (removing minerals or altering them into 'lighter' clay minerals).

Why is this an issue? Here are a series of long sections from Galway's Estrades project in Canada. These images came from the November 2006 Technical reported prepared by Scott Wilson RPA for Cogitore Resources Inc.

Here are a series of long sections showing the distribution of each major economic element (there are sections for gold and silver but they constitute a very small part of the rock and won't impact the bulk destiny by any significant amount).

Zinc

Copper
Lead

Bulk Density
Here is an annotated version where I have drawn on (badly) the >1% Pb, Zn and Cu grade contours.


You can see that in general there is a reasonable correlation between grade (total sulfide content) and SG, but it isn't perfect. We can see that the Bulk Density (SG) varies from less than 2 g/cm3 (blue) >4 g/cm3 (a 100% difference). So you can see the problems that could be caused if you use a single bulk density value for a rock type or ore zone, or use an arbitrary values. 

Most companies have adopted the "take lots of samples" approach as collected bulk density measurements is cheap and quick and will allow you to accurately model the changes in the bulk density within a deposit.

However, if you see a company using single or average bulk density values (or mathematical formulas) in their resource calculations, it should make you stop and think for a moment as there have been some major and costly failures where companies haven't used the correct SG value.

One interesting technical question to ask - specifically directed towards Hermosa - is what is the correlation between sulfur assays and bulk density?


Friday, January 13, 2017

Hermosa - a summary

We seen over the past week a series of posts on Arizona Mining's Hermosa Taylor deposit that it has issues, and I apologies for being negative on this project but we are talking about a company that has market cap of ~$600M. They have sufficient funds to everything to the highest standards. For me, the most frustrating part is that they appear to have been careless (the manganese issue) and dishonest by 'erasing' references to 'clean' concentrates and decreasing recoveries and concentrate grades.

If I was a shareholder, I would feel that I was entitled to a honest reply from the company. Instead AZ management have gone into "ostrich" mode and buried their heads in the sand.

Manganese

The manganese question could tacked head-on. All they have to do is go back to the assay database and check see if the manganese is pervasive or just found in a few areas (i.e. close to the manto oxide zone). This would take a couple of days to do, and would have allowed them to state that the manganese was a local issue and by accident some of the samples used for preliminary metallurgical sample contained significantly more manganese than the majority of the deposit.

However, AZ management decided to take the mature approach. They removed the following statement from their latest presentation, but you can still find it in their Jan 7th 2016 PR (link).

Dec 7th Presentation - slide 6
and in the technical report

Page 6 - Oct 2016 Technical report - this statement is repeated on pages 7 and  94

I wonder if we will see an amended technical report with an 'updated' metallurgical section in the coming weeks?

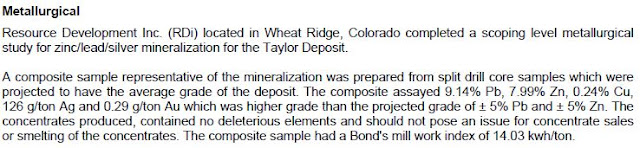
Metallurgical Recoveries and concentrate Grades

I'm extremely concerned about the changes to the metallurgical recoveries and concentrate grades values in the recent presentations. They match the values in the technical report, so why where incorrect values used in the December 7th presentation?

The timing was a bit strange as the date of the presentation coincides accidentally with the announcement that they had raised $36M to develop the project (link)?

My concern is that maybe this was another careless mistake, like the manganese issue, and bulk density question. However, when you look at it, that is a lot of faux pas from a single company.


The Elephant in the room

I apologize for sounding negative, AZ have defined a lot of resources and control ~17,500 acres of prime exploration ground. They've done a lot of drilling, so why don't we have a look at where those holes are:

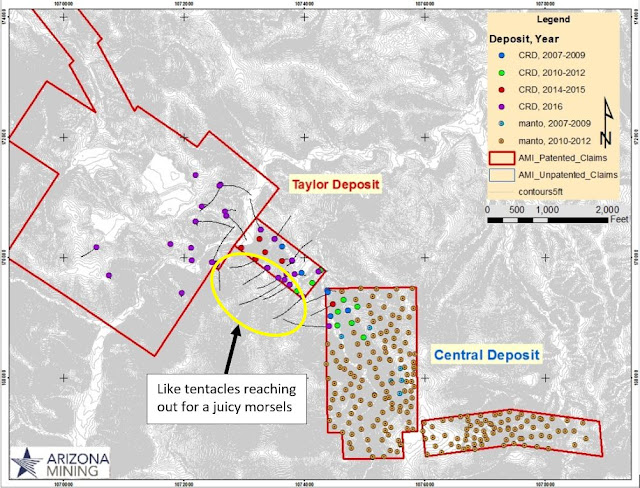
DO NOT CROSS THE RED LINES
Wow, all of the drill-holes are on private land? OK, I get it, permitting is much easier on private land, but AZ have been drilling Hermosa since July 2007 (funny fact - it took them 7 months to release the results (link*)), surely in that time they would have got a permit of two to allow them to drill in the lava public land surround the deposits?

I like the way (circled in yellow) they've had to drill these weird orientated holes, like tentacles of a perverted squid in a Hentai cartoon reaching out for a nubile young lass.

*press releases prior to this (link and link) were releasing assay results from the re-sampling of the historic ASARCO drill sample pulps. 

The question you have to ask is:

Why? It is reallly that hard to get a permit to drill a few holes in the Coronado National Forest?

If you can't get a drill permit, imaging the issues that they will face when they try and develop the project? I'm sure it will be easy, just like at Resolution (linklink or link)!

Well, at least they will have got someone on-board to buy the concentrate, but then again the observations from Ocean Partners are just words. they mean nothing as we have to be realistic here, there is going to be no mining, and no concentrates being produced from Hermosa in the next 10 years.

up to 6 years just for the permits
and some fecking nimbys


Heck, if they want, I'll sign an MOU to discuss the precious metal stream....


Thursday, January 12, 2017

Hermosa - January Update

AZ released some spiffy new drill-results today (link)


When you look at the accompanying plan map, you can see why the results from hole 396 were good, and the other holes didn't really hit much, just a few narrow zone and veins, so we'll ignore them.

high grade zone circled in red
When we zoom in, we can actually see that hole 396 wasn't a huge intercept of medium grade mineralization but a series of narrower high grade (>10%) zones within a large zone grading between 2.5-5% Zinc.

Red >10% Zinc; Blue 2.5-5% Zinc
Hole 396 was drilled to follow-up on the thick intercepts in holes 333, 334, 335 and 374. When you step back you can see that there are a couple of areas where the mineralization is much thicker than everywhere else.

Central zone centered on hole 333, 334 and 396; second zone centered on hole 104
You can see that there are 2 distinct orientations to the zinc mineralization:
  1. Predominant - A series of sub-horizontal (dipping down to the left or northwest) zone related to rock contacts and the basal low angle fault.
  2. Vertical pipes (?) of base metal mineralization - most likely related to vertical faults being used as conduits for mineralized fluids.
This is important as for accurately calculating the resources you need to model each zone separately, with their own bias to the direction (search ellipse) that the mineralized intercepts are joined together to link adjacent drill-holes. This is important for fault hosted mineralization (the vertical stuff) as the fault zone could be very narrow (a few tens of meters) and very high grade.

Check out the copper distribution:


The copper appears to show a bit of zonation. the deeper mineralized horizon is much richer than the upper Zinc horizons, except where you see those nice thick intercepts, is that telling us something? You would expect to see elevated copper in the hotter parts of the system, deeper or nearer the source intrusive, but also where you get zones of weaknesses where fluids will be focused.

In Summary, a good hole, but not an unexpected one. I'll be guessing that we'll be seeing a lot more holes being drilling into this zone over the coming months.

If you want, you can download the 3D model from here (link).


Tuesday, January 10, 2017

Almadex - El Cobre

We got some more drill results from El Cobre last week, and I've decided to use this project as the first to do an officially crap (tm) TAG resource guesstimate.

Summary


  • Small and low grade
    • ~101Ktonnes copper @ 0.19% Cu
    • ~640Koz gold @ 0.43 g/t Au

Let us quickly compare the market caps of a few favorite copper-gold exploration companies:

  • Almadex = CND$70.7M
  • Cordoba = CND$48.92
  • Regulus resources = CND$75.58
Regulus and Cordoba have decent project projects with resources:
  • Alacran = 53.5 Mt at 0.7% Cu and 0.37 g/t Au
  • Anta Kori = 290Mt @ 0.48% Cu and 0.36 g/t Au
The assays from the drilling at El Cobre just show that they have a few moderately wide, average grade zones surrounded by low grade dirt. I thought that I was missing something. So I brought everything into Leapfrog Geo to see how much gold and copper there is.


WARNING

These numbers could cause shock, amazement and cardiac arrest. Please sit down, breathe slowly before calling your broker...


Well, that is deeply unimpressive, but not unexpected.

In general the 'massive' intercepts were nothing special. So here is the latest 3D model (including holes 16 and 17) and the spiffy spreadsheet from here (link), so you can play with the numbers and call me a retard.

So,  Almadex is expensive, Regulus is cheap.

Background rubbish

This is a global 'resource' from all three mineralized areas (Norte, Porvenir and Encinal zones), and I used the 'split assay' data which back calculated the residual grade (i.e. outside of the narrower high grade intervals), to try an give a more accurate value.


Grades are also composited over 5m intervals.

Gold


Copper


I used the following attributes to calculate the resources. the important one for non-technical people is the base range (circled) - 200 - which basically means that Leapfrog Geo uses a 200m search radius to connect the grade shells, which, for a porphyry system, is a good approximation for inferred resources.

I also used a specific gravity of 2.7 tonnes/m3.

If you want the complete LF Geo project - flip me an e-mail (theangrygeologist@gmail.com) and I sent it to you.

Monday, January 9, 2017

Hermosa - more parlor tricks


I don't know how I missed it, we can also see that not just has the recoveries decreased, but the grade of the concentrate has also had a bit of a haircut:
  • Lead - original = 79%, new and improved = 75% - a 4% difference
  • Zinc - original = 57%, new and improved = 56% - a 1% difference
If you didn't know, just to explain Arizona mining insist on using imperial units (which are fecking retarded) so their resource is in short tons not metric Tonnes.

  • 1 ton = 2000 lbs or 907.18kg
  • 1 tonne = 1000kg or 2204.6 lbs

So, if they were reporting their resource in metric tonnes it would be:

  • Indicated = 28.25 million, beautiful metric tonnes
  • Inferred = 75.07 million metric tonnes
A bit different, and I apologize for not seeing it sooner.


Friday, January 6, 2017

Hermosa - a sleight of hand

When you have a project that is suffering from a bit of turbulence, what do you do?

Easy - just remove any misleading statements from your presentation.

We're going to look at AZ's presentations on the Taylor deposit from the 7th December (link) and the 22nd December (link).


  • Great concentrate comments - gone (it makes for a less cluttered slide)
  • we now have different recoveries for Zinc and Silver


Slide 3 - original


Slide 3 - new and improved presentation

they still have the highly experienced management team
We also have different recoveries now

Slide 6 - original


Slide 14 - new and improved

oh no, the concentrate isn't clean anymore!


So in 2 week the recoveries have changed from:

Zinc Concentrate

  • Zn - original = 87%, new and improved = 85.5% - a 1.5% difference
  • Ag - 8-15% original, average ~12%, new and improved = 15%, a 3% difference 
Lead Concentrate
  • Pb - original 93%; new and improved = 92.9% recovery, no real difference
  • Ag - 76-85% recovery of silver, average ~80%; new and improved = 76%, a 4% difference
That is impressive, in 2 weeks with no additional testing AZ have managed to decrease recoveries of Zinc and Silver. Were the values in the earlier presentation wrong?


Wednesday, January 4, 2017

Alexco - a question

After Alexco released their resources for the Bermingham drilling I decided to go back and see what my Leapfrog Model gave as an officially bad resource.


I used a 300 g/t cut-off (the blue cells) and we came close to the official indicated resource numbers (link).

official!
My question is this - do you want me to include my officially bad calculations in my posts? 

I've been holding back (as I'm mean) as I often want to check them against the official numbers first to check that the assumptions I'm using are close to those being used by the professionals.


Hermosa - Evening Gown

Bulk density.

Exploration is like making love to a beautiful woman. Lots of effort and generally unsuccessful (a jealous look towards southern Peru), and then we quickly move from one to another with high hopes that with 'this one' you'll be successful.

So your porphyries are BBW who can cook, clean and look after you for a long time. High grade gold deposits are amazing, but it is all over to soon. So where does the Beautiful Taylor fit in, is she as flabulous as we are told (remember - like partners, junior companies will never admit that they've got an ugly one....)

To find if you project is any good we (as me are scientists) need to measure her figure (tonnes) and how pretty she is (the grade). To do this you need an incredibly handsome, intelligent, probably bearded exploration geologist to go out there, erect his drill on her and prick her many times.

So in this sense is the beautiful Taylor flabulous or a bit anorexic?
In exploration we're funny, we spend lots of time and money working out how pretty she is (semivariables, geostats, kriging, ID2, 3, 4, 5.....99), 'cus we get to play with spiffy computer programs, use hard to understand words (to sound smarter), because we think it sounds sexy and impress all the girls at the PDAC.

However, to calculate her tonnage it is a bit more boring - it is volume (girth) x bulk density (or specific gravity). The girth comes from all of our hard pricking. The bulk density info generally comes from weighing pieces of core (if you're kinky you can cover them in wax) in water and air and comparing their weights. This is cheap (a few hundred bucks for a decent scale) so you can DIY with checks done by a professional lab to make sure that everything is kosher. Here is a more complete description (link)

Some companies take the holistic approach and take bulk density measurements from everything (e.g. Mag Silver at Cinco de Mayo - they collected >16000 SG measurements, but only 585 were used in the inferred resource calculation).

We've all been reading about all the deep penetration happening at Taylor, but, as I am a sad bastard, I was a little bit concerned that for a >100Mt deposit (including 31 Mt of Indicated resources), AZ had only taken 30 bulk density measurements, they decided it was more fun to use excel!


They tell us their fancy formula is accurate (+/-10% of the measured values, so only so +/- 11 Mt). I have issues with this, as we know that Taylor homogeneous deposit, they have bits that are:
  • Sulfide ore - The Pb and Zn are in sulfides (galena and sphalerite) - the calculated bulk density will probably be OK for this zone (even though the calculation ignore pyrite).
  • Oxide ore - Pb and Zn will be in oxides and carbonates which have a lower SG than sulfide minerals. Oxidized rock could also have a lot of cavities as soluble minerals will have been removed.
  • Mixed Ore - this will be a mixture of oxide and sulfide minerals and its SG will vary by how much of each type is present.

I wanted to see if this calculated SG method was standard practice for manto/CRD deposits, so I checked other deposits to see what SG values they used and how they calculated them:
  • La Encantada - SG = 2.5 tonnes per cubic meter (t/m3)
  • Platosa (285 measurements) = 3.2 t/m3 (8.3% Pb, 9.88% Zn) - M&I resources
  • Ayawilca (106 measurements) - 3.6 t/m3 (5.8% Zn, 0.2% Pb) - inferred resources -Zinc Zone
  • Cinco de Mayo (585 measurements) - 3.47 t/m3 (2.9% Pb, 6.47% Zn) - inferred resources
  • Accha (50 samples) - 2.5 t/m3 (8.48% Zn, 0.89% Pb) - Indicated resources (Oxide)
  • Sierra Mojada (5335 samples) - modeled (i.e. the created a model from the thousands of SG measurement they took)
We can see that the SG varies considerably, with oxide deposits with lower SGs (Accha and Encantada), and sulfide deposits with high SGs. You can also see that none used a calculated SG value, they all took lots of measurements so that they could accurately determine the SG to use in the resource calculations.

Why is this important? Lets work backwards - Hermosa state that the average SG for Hermosa is 3.43 tonnes per cubic meter, and depending on the Lead and Zinc grade this value will vary (so they are using a modeled SG value). 

Source: Oct 2016 Technical report
They have 113.89 million tonnes of resources, so:
  • 113.89/3.43 = 33.2 million cubic meters of ore:
  • 33.2 x 3.2 (Platosa SG) = 106.2 Mt of resources - you lose 7Mt of ore
  • 33.2 x 3.6 (Ayawilca SG) = 119 Mt of resources - you gain 5 Mt of ore
You change the SG value by a little bit and you can make huge changes in the amount of ore you have, and this is where I have an issue. The formula that they are using assumes:

  • All the Lead and Zinc is in Galena and sphalerite (sulfide minerals)
    • they won't be in the oxide and transitional ore zones as lead and zinc oxides and carbonates have a lower density and oxide ore can be quite vuggy (have a lot of spaces - i.e. areas with no density)
  • Why have't they included pyrite in the calculation? Its heavy, 5 t/m3.

AZ have spent massive amounts of money on drilling 1+km deep drill-holes (they are paying $262/meter), but didn't want to spend a few hundred bucks (and a technician) to take systematic density measurements throughout the deposit. What we got instead is a semi-accurate excel formula (the author of the technical report even outlines those flaws).

It looks like AZ has taken the lazy, cheapo option

again..

Tuesday, January 3, 2017

Hermosa - (lack of) Talent Section

Metallurgy and ore zones

I'm always suspicious of metallurgical data. Junior companies like to skew the results for Maximum Impact (tm) by sampling the best and highest grade material (to steal a yank term - the 'winningest' ore) to maximize recoveries. As we saw with Sandra Escobar, often (i.e. always) the high-grade material is very different (in form and style) to the majority of the material that forms a 'deposit', and there can be drastic differences in recoveries for low, average and high grade material.

Fortunately, AZ keep us calm with this from the latest technical report:
all is good
At Taylor we can see that AZ sent a single, 139lb, representative (for a 100Mt deposit - or just 0.0000000063% of it) for metallurgical testing. It was a composite made from 18 separate samples.


You can see that the grade of the met sample is twice that of the resources (not exactly representative), and we can see in the table above that there are huge range in grades from the individual 18 samples making the composite (I've included my spreadsheet with the 3D model (link).
  • Lead: 7.99% vs 4.4% (range - 1.17% to 28.43%)
  • Zinc: 7.98% vs 4.7% (range - 1.11% to 22.8%)
  • Silver: 3.53 oz/t vs 1.8 oz/t (range 0.53 to 14 oz/t)
  • Copper: 0.28% vs 0.1% (range 0 to 1.32%)
  • Manganese: 1.32% (range 0.68% to 10%) - we have no 'official' Mn numbers in the resources
So it isn't a representative sample. As a prelim study it shows that you get very good recoveries for Pb, Zn and Ag from high grade ores, but will we see similar recoveries for average and low grade material that makes up the majority of the deposit?

My gut feel is yes, but i'm going to estimate that it will be a few percent lower (i.e. high 80s for Pb and Zn), but it would have been nice that AZ used these recovery values for the ZnEq calculation!

I also found these sections interesting. You can see that the Hermosa Central oxide zone extends down into and separates the upper and lower sulfide zones. Is this contact sharp or do we have a more complicated zonation from oxide through a mixed zones (with both oxide and sulfide minerals) into the sulfide zones?
Some rusty stuff in the middle like jam in a black forest gateau
This is important as each zone will have different characteristics (for mining, treatment) and  recoveries for each metal. We know the Central deposit contains significant manganese (it was being promoted as an Ag-Mn deposit), is the manganese evenly distributed throughout Central-Taylor or restricted to specific areas?

Would we also see a corresponding drop in Mn values in the concentrates? I was intrigued, so I went a bit further and brought in the location of the samples that were collected for the metallurgical sample to check that the samples were not just taken from a single hole but were spread throughout the deposit.

That manto is a bit of a prick

Ohh, we can see that the samples were collected throughout the deposit. However, a few appear to have been collected within or very close to the manto oxide zone, and they appear to contain a lot more Mn (>5%) than the samples taken from the deeper sulfide zone (<2%).

If you take away the samples containing more than 5% Mn, the grade of the composite drops from 3.42% Mn to 1.79% Mn, and if we use bad maths:

  • Original met composite grade = 3.42% Mn gave a concentrate grade of 1.33% Mn
  • TAG's composite grade = 1.79% Mn - would this give a concentrate grade of 0.7% Mn?
    • I have no idea if this is good or bad, but it may be more manageable than 1.36%

It looks like AZ were focusing on maximizing the Pb and Zn recoveries (from their representative metallurgical sample), and have appeared to have FUBAR-ed the deposit by carelessly including a few samples with a metric F*ck-tonne (I'm using official SI units here) of manganese.

Imagine if AZ had been clever and had known that Mn was an issue in Zn concentrates (I admit that I didn't). They could have trawled through their assay database and picked good samples with low Mn values for the metallurgical sample and no-one would have known.

oops
You missed a trick, now you get to have nice awkward interviews on BNN, every investor, newsletter writer and awesome mining blog dudes irritating the shit out of you by asking....


Monday, January 2, 2017

Hermosa Beauty pageant - Swimsuit section

There has been a lot of news about Arizona Mining's Hermosa Central Taylor deposit. The funny thing is, most of it is self-inflicted, if they had spent a bit more time thinking about what they were doing and (the hardest of all) why*.

*Just me making a naive comment - I try to think about the possible end game for a project (sell or develop) whereas most exploration companies are just interested in the short-term gain.

I'm going to take you through the Taylor beauty show, but first my disclaimer.

The 3D model of the drilling data is not very accurate, because:
  • Hole locations have been sourced from technical report and also digitized from plan maps provided in press releases (accuracy +/- 30m).
  • No dip, dip direction or hole depths have been provided and this has been estimated from plan maps accompanying the press releases.
  • No hole deviation - drill-holes bend slightly, the longer the hole the more bent it becomes (deviation). I haven't included hole deviation in the model as it is never included in PRs.
  • No hole depths - I've used deepest reported interval +200m 
You can download the 3-D model from here (link).

I've split this post up into several section (I'll publish one per day), so that people aren't overwhelmed by a massive post containing everything.

Geology-wank

The Taylor deposit is continuation of the Hermosa/Central silver-manganese oxide (manto oxide) mineralization to depth. There is no clever exploration here, Arizona Mining just been following the manto down dip to nearly 1 km depths.

Central = pink; Taylor = yellow

So - Taylor and Central are different names for different parts of the same deposit.

Swimsuit section - Recent drill results

There have been a flurry of press releases announcing some fairly spectacular drill-results (link and link).We can see that the majority of the mineralization is in CRD (Carbonate replacement deposits) with a few veins scattered around the project. So the veins intersected by hole 359, 386 and 386 give some nice numbers and are interesting locally, but in the big scheme are irrelevant.

not many veins.. Red = Dec 15 DH, Green = Dec 21 DH
Hole 359 is a classic case of what happens when an almost vertical hole hits a vertical veins - a massive core intercept from a vein that is probably only 1-2m wide. So, the veins are irrelevant (except for PR headlines). If you look more closely at hole 359, you would expect it to hit the main Taylor deposit at around 1,250m depth, so why did they release the assays before the hole got to the main mineralized zone, did something scare them......

There are some very nice hits, but we do see a lot of grade smearing from narrower high grade zones over wider thicknesses, which suggest that only a part of the Taylor zone is strongly mineralized. For example:

  • HDS-353 - 9.8m @ 8.19% Pb, 12.21% Zn inc. 5.2m @ 14.75% Pb, 22.04% Zn
    • residual grade 4.6m @ 0.77% Pb, 1.1% Zn
  • HDS-382 - 27.4m @ 2.07% Pb, 1.06% Zn, inc. 8.2m @ 4.12% Pb, 2.39% Zn
    • residual grade = 19.2m @ 1.19% Pb, 0.9% Zn
  • HDS-387 - 34.3m @ 9.56% Pb, 5.41% Zn inc. 12.6m @ 21.84% Pb, 11.12% Zn
    • residual grade = 21.7m @ 2.43% Pb, 2.1% Zn

We see this repeatedly, is this the same for all the thick intercepts? Is Taylor really just a 5m zone of economic mineralization (albeit at 10+% Pb+Zn) surrounded by sub-economic country rocks? There isn't enough data to say.

Here is a long section through the deposit.

blue line = TAG's BS ore zones.
I've drawn a series of blue lines showing my guesstimate ore horizons. You can see that the mineralization is getting very deep to the left (NW), and there isn't really much point drilling out there, you'll get some reasonable hits, but you'll never mine it, just ask BHP-Rio how much a 1km deep shaft costs to excavate in Arizona....

I've also drawn a couple of red circles around some exceptionally thick intercepts. You can clearly see that they are different, hey are much thicker than the mineralized zones in adjacent holes.

I think that this is an impact of maybe syn or pre-mineral (basically faulting before or at the same time as mineralization occurred) faulting, with the mineralizing fluids using and replacing the fault zone, forming much thicker, but not very wide, vertical pipe(s) of mineralization. If that is the case, you would expect them to be modeled a bit differently in the resource model.


Exploration Upside

Short version - good

There are a few areas where the current resources can be expanded

black line = slide through the main Taylor body
red = 100m radius around dill-holes (indicated resources), blue = 200m radius (approx. limits for inferred resources)
You can see that the depoist is open to the NW (upper right) and also to the NE and SW, and regionally the project that covers a number of historic base metal mines.

red star = old mine
and a number of high-grade veins (map below).
veins, lots of lovely veins
but unfortunately, it looks like every silver lining has a black cloud!


part 2 tomorrow